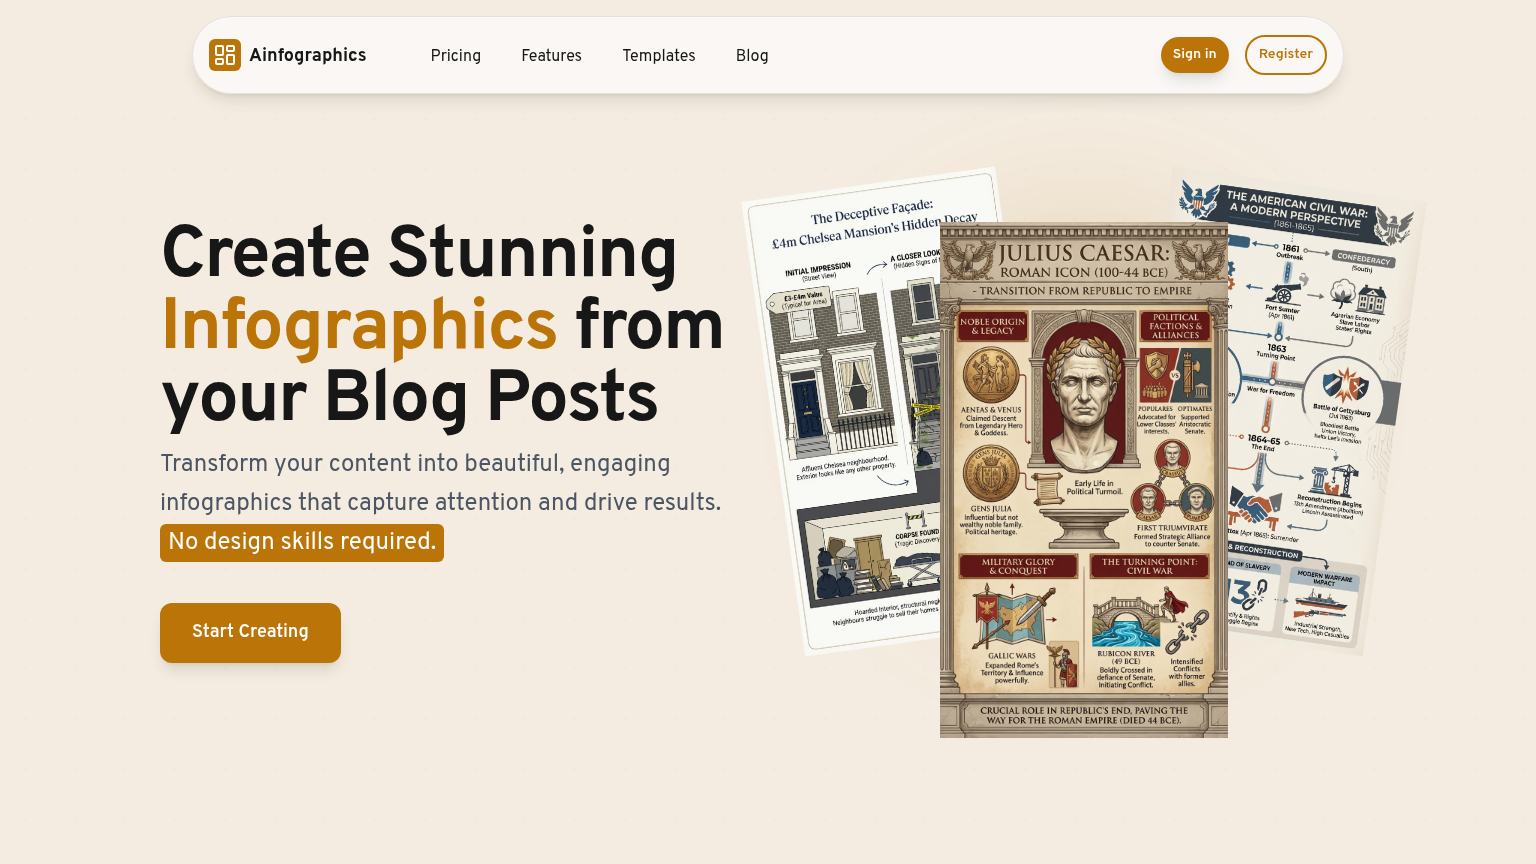
Ainfographic
Ainfographic is a comprehensive tool designed to help users create stunning, data-driven visualizations. With its intuitive interface and robust features, it simplifies the process of turning complex data into informative and engaging infographics. By leveraging AI-driven insights and a vast library of templates, users can quickly produce high-quality graphics that captivate audiences and drive meaningful conversations.
What is Ainfographic
Ainfographic is a cutting-edge tool that empowers users to create professional-grade infographics with ease. Built on a foundation of machine learning and artificial intelligence, it analyzes data and suggests the most effective visualization strategies. The platform offers a vast library of customizable templates, each carefully crafted to cater to specific storytelling needs.
Users can also import their own data or leverage Ainfographic's vast database of public datasets. The tool's user-friendly interface and real-time collaboration features make it an ideal choice for individuals and teams alike. With Ainfographic, users can transform complex data into compelling narratives that resonate with diverse audiences.
Its unique value proposition lies in its ability to automate the infographic creation process, saving users time and effort while ensuring accuracy and consistency. As a result, Ainfographic stands out in its category by delivering unparalleled speed, accuracy, and visual appeal. Whether you're a marketer, researcher, or communicator, Ainfographic is the perfect tool to unlock the full potential of your data and convey your message effectively.
How to use Ainfographic
- 1 STEP 1: Connect your data source to Ainfographic's platform, either by importing a file or linking to a public dataset.
- 2 STEP 2: Utilize Ainfographic's AI-driven insights to suggest the most effective visualization strategies for your data.
- 3 STEP 3: Select a template from Ainfographic's vast library, which is carefully curated to cater to specific storytelling needs and styles.
- 4 STEP 4: Customize your infographic by adjusting colors, fonts, and layouts to suit your brand identity and messaging goals.
- 5 STEP 5: Export your final infographic in various formats, including PDF, PNG, and interactive web embeds, ready for sharing and presentation.
Primary Features
Applications & Use Cases
- Creating marketing materials for product launches and campaigns
- Developing informative infographics for research papers and academic presentations
- Designing engaging visuals for social media and online content
- Presenting business insights and performance metrics to stakeholders
- Conveying complex data and statistics to diverse audiences
Pricing
Ainfographic offers a free plan with basic features, including 100,000 data points, 10 templates, and 1 user.
Paid plans start at $29/month for the Pro tier, which includes 1 million data points, 50 templates, and 5 users.
The Business tier at $99/month offers 5 million data points, 100 templates, and 10 users, along with advanced collaboration features.
Custom Enterprise pricing is available for large teams and organizations, providing tailored solutions and support.